Overview#
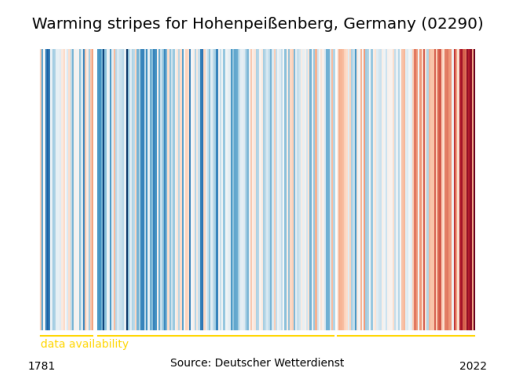
Hohenpeißenberg, Germany: 245 years of mean air temperature, one stripe per year from 1781 to 2025 — fetched and drawn with wetterdienst.
Global warming is not an opinion.
Erderwärmung ist keine Meinung.








[!WARNING] This library is a work in progress! Breaking changes should be expected until a 1.0 release, so version pinning is recommended.
Wetterdienst gives you weather, climate and hydrology data from 22 national services through one interface: one way to find a station, one way to ask for values, one shape of result. It is a polars-based Python library, a command line client, a REST API, an MCP endpoint and a web app, all serving the same data.
Contributions and feedback are very welcome — we do not use most of this data ourselves, so what you need is what tells us what to build next. Hand in an issue or a PR.
What we support#
Provider |
Country |
What you get |
|---|---|---|
🇩🇪 Germany |
observations, MOSMIX/DMO forecasts, radar, warnings, road weather, derived indices |
|
🇪🇸 Spain |
observations (API key) |
|
🇨🇿 Czechia |
observations |
|
🇩🇰 Denmark |
observations, incl. Greenland and the Faroe Islands (API key) |
|
🇬🇧 England |
hydrology |
|
🇫🇷 France |
hydrology |
|
🇨🇦 Canada |
observations |
|
🇫🇮 Finland |
observations |
|
🇦🇹 Austria |
observations |
|
🇵🇱 Poland |
meteorology, hydrology |
|
🇵🇹 Portugal |
observations |
|
🇳🇱 Netherlands |
observations (API key) |
|
🇱🇹 Lithuania |
observations |
|
🇬🇧 UK |
MIDAS Open observations (CEDA account) |
|
🇫🇷 France |
observations, SYNOP |
|
🇨🇭 Switzerland |
observations |
|
🇳🇴 Norway |
Frost observations (API key) |
|
🌍 worldwide |
GHCN daily and hourly, stations across the globe |
|
🇺🇸 USA |
observations |
|
🇧🇪 Belgium |
observations |
|
🇸🇪 Sweden |
observations |
|
🇩🇪 Germany |
hydrology (Pegelonline) |
Across those: nearly 600 canonical parameters, resolutions from 1 minute to annual, and archives
reaching back centuries where the service keeps them. Every provider is reached the same way, and a
parameter means the same thing whichever service reports it — temperature_air_mean_2m is the mean
air temperature at 2 m, converted to the same unit, everywhere.
Licenses and usage requirements differ per provider, so check the data chapter before you publish anything built on them. It also lists every dataset and parameter per provider.
Features#
Stations, values and station history (metadata changes) through one request model
Find stations by name, id, distance from a point, bounding box or rank
Request by
parameters,periods,start,end; tune the rest throughSettingsUnit conversion, interpolation and summarization for a point between stations
DWD weather alerts (CAP warnings) with GeoJSON geometry, by community or district
SQL queries over results, export to CSV/JSON/Excel/Parquet/Zarr and to SQLite, PostgreSQL, CrateDB, InfluxDB and DuckDB
Command line client, REST API and a public Docker image
MCP (Model Context Protocol) endpoint, so LLM agents can query the data as tools
Web app with map-based explorer, forecasts, climate stripes and a glossary, at wetterdienst.eobs.org
Setup#
pip install wetterdienst           # from PyPI
pip install wetterdienst[export]   # with an extra
pip install git+https://github.com/earthobservations/wetterdienst  # most recent
Extras: bufr, cratedb, duckdb, eccodes, excel, export, influxdb, interpolation,
knmi, mcp, mysql, pdf, plotting, postgresql, radar, radarplus, restapi, sql.
Check the installation with wetterdienst --help.
On Linux, a process that imports ecCodes (bufr or eccodes extra) itself, before wetterdienst
does, and then imports pyproj (which radarplus brings) can crash at exit
(ecmwf/eckit#354). See
known issues
for the workaround.
Prefer Docker? The image ships with the optional dependencies included:
docker pull ghcr.io/earthobservations/wetterdienst
docker run -ti ghcr.io/earthobservations/wetterdienst wetterdienst --version
See the Docker chapter for running the REST API and the app from the image.
Example#
Daily precipitation for Zinnwald-Georgenfeld, August 2002 — the flood:
from wetterdienst.provider.dwd.observation import DwdObservationRequest

request = DwdObservationRequest(
    parameters=[("daily", "climate_summary", "precipitation_amount")],
    start="2002-08-11",
    end="2002-08-13",
).filter_by_station_id(station_id=(5779,))

stations = request.df
stations.head()
# ┌────────────┬─────────────────┬────────────┬─────────────────────────┬───┬───────────┬───────────┬──────────────────────┬─────────┐
# │ resolution ┆ dataset         ┆ station_id ┆ start_timestamp         ┆ … ┆ longitude ┆ elevation ┆ name                 ┆ region  │
# │ ---        ┆ ---             ┆ ---        ┆ ---                     ┆   ┆ ---       ┆ ---       ┆ ---                  ┆ ---     │
# │ str        ┆ str             ┆ str        ┆ datetime[μs, UTC]       ┆   ┆ f64       ┆ f64       ┆ str                  ┆ str     │
# ╞════════════╪═════════════════╪════════════╪═════════════════════════╪═══╪═══════════╪═══════════╪══════════════════════╪═════════╡
# │ daily      ┆ climate_summary ┆ 05779      ┆ 1971-01-01 00:00:00 UTC ┆ … ┆ 13.7516   ┆ 877.0     ┆ Zinnwald-Georgenfeld ┆ Sachsen │
# └────────────┴─────────────────┴────────────┴─────────────────────────┴───┴───────────┴───────────┴──────────────────────┴─────────┘

values = request.values.all().df
values.head()
# ┌────────────┬────────────┬─────────────────┬──────────────────────┬─────────────────────────┬───────┬─────────┐
# │ station_id ┆ resolution ┆ dataset         ┆ parameter            ┆ timestamp               ┆ value ┆ quality │
# ╞════════════╪════════════╪═════════════════╪══════════════════════╪═════════════════════════╪═══════╪═════════╡
# │ 05779      ┆ daily      ┆ climate_summary ┆ precipitation_amount ┆ 2002-08-11 00:00:00 UTC ┆ 67.9  ┆ 10.0    │
# │ 05779      ┆ daily      ┆ climate_summary ┆ precipitation_amount ┆ 2002-08-12 00:00:00 UTC ┆ 312.0 ┆ 10.0    │
# │ 05779      ┆ daily      ┆ climate_summary ┆ precipitation_amount ┆ 2002-08-13 00:00:00 UTC ┆ 26.3  ┆ 10.0    │
# └────────────┴────────────┴─────────────────┴──────────────────────┴─────────────────────────┴───────┴─────────┘

values.to_pandas()  # if you would rather have pandas
The same thing from the command line:
wetterdienst stations --provider=dwd --network=observation --parameters=daily/kl --all
wetterdienst values --provider=dwd --network=observation --parameters=daily/kl --station=1048,4411
Links#
Documentation: wetterdienst.readthedocs.io (usage, contribution, changelog)
Examples and benchmarks
What we stand for#
🏳️🌈🏳️⚧️ We stand with the LGBTQI+ community.
✊ No place for Nazis. FCKNZS.
🌡️ Global warming is not an opinion.
🔓 Weather data belongs to everyone.
Acknowledgements#
We want to acknowledge all environmental agencies which provide their data open and free of charge first and foremost for the sake of endless research possibilities.
We want to acknowledge all contributors for being part of the improvements to this library that make it better and better every day.
Supported by#


Special thanks to the kind people at JetBrains s.r.o. for a PyCharm licence through their open-source support programme, and to Anthropic for a Claude Max subscription for open-source maintainers.